
Sports Facilities Market Readiness
This sample report illustrates how your Digital Entity is evaluated for the Sports Facilities market. Using our Market Intelligence Engine, we analyze the digital assets that influence whether municipalities, school districts, sports organizations, facility owners, architects, engineers, and developers can find your business, understand your synthetic turf and artificial grass solutions, and trust you enough to request a consultation or proposal.
Each market receives independent scores for Digital Intent, Digital Presence, and Digital Authority, along with estimated revenue potential and practical recommendations for improvement. Because every market has different customer expectations, a business may perform very well in one market while requiring significant improvements in another. The digital assets required to compete for sports facility projects are different from those needed for parks and recreation, education, hospitality properties, commercial developments, or residential installations. A strong overall website does not automatically mean your business is competitive in every market.
Every report is evaluated within a specific market coverage level. Businesses may compete locally, regionally, nationally, or internationally, and each level presents different competitive environments, procurement processes, and digital requirements.
Readiness
Intent
Presence
Authority
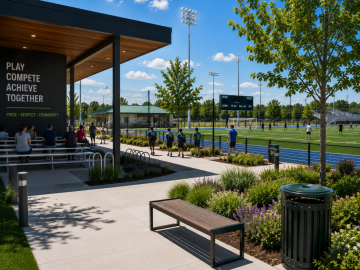
Sports Facilities
We evaluate your assets across Intent, Presence, and Authority - the three pillars required to rank, get found, and compete in this market.
Your Readiness for the Regional Sports Facilities Market
Evaluated for: Regional CoverageThis evaluation measures how prepared your business is to compete for Sports Facilities projects within your Regional service area.
Intent
StrongYou clearly communicate what you do and who you serve.
Presence
Needs WorkNeeds Work
Authority
Needs WorkNot enough trust signals, proof, or authority to build confidence.
Market Revenue Calculator
Explore how changes in project size, pricing, production capacity, and in Regional Sports Facilities market coverage may influence your annual revenue opportunity.
Top Opportunities
You have key gaps that are holding you back in this market.
You need more Regional project pages with photos, details, and results to build relevance and trust.
Missing licenses, certifications, warranties, and other authority signals that build trust.
See every gap, priority, and recommended action.
Market Entry Options
Choose the path that fits your current needs.
Strengthen your core digital foundation and essential assets.
Compare local, regional, and national requirements.
See every missing authority signal, priority, and implementation plan.
What Do These Scores Mean?
Many businesses assume they compete simply because they install synthetic turf. Online, however, every market has different customer expectations, competition, and buying behavior. Competing for sports facility projects requires different digital assets than competing for residential lawns, hospitality properties, commercial developments, municipalities, or other public markets.
This Market Readiness Report evaluates how prepared your Digital Entity is to compete within the selected market. Your overall score is based on three core business pillars:
Intent - Does your digital presence clearly communicate that you serve this market?
Presence - Can potential customers find your business where they are searching?
Authority - Have you established enough trust, experience, and credibility to compete effectively?
Higher scores generally indicate a stronger digital foundation, greater market competitiveness, and better long-term opportunities to attract qualified leads.
Competing in the Sports Facilities Market
Sports complexes, athletic departments, stadiums, recreation centers, training facilities, and public sports organizations invest in synthetic turf and artificial grass for athletic performance, durability, player safety, and reduced maintenance. Common applications include soccer fields, football fields, baseball and softball facilities, training areas, warm-up zones, multipurpose athletic complexes, and surrounding landscape areas.
Decision-makers typically evaluate contractors based on completed sports facility projects, product performance, sport-specific expertise, installation experience, safety standards, warranties, and the ability to work with architects, engineers, municipalities, and public procurement processes.
This report helps you understand how prepared your Digital Entity is to compete for Sports Facilities projects within your selected market coverage.
Why Market Readiness Matters
A website alone does not guarantee visibility. Sports facility projects are often awarded to businesses that clearly demonstrate experience with athletic installations, showcase completed projects, and establish credibility with municipalities, school districts, sports organizations, architects, engineers, and facility owners.
The Market Intelligence Engine evaluates whether your current digital assets support your ability to attract qualified decision-makers and compete for sports facility opportunities. Strengthening these assets improves long-term visibility while creating more opportunities to secure athletic and public-sector projects.
Understanding Market Coverage
Market Readiness is always evaluated within a selected coverage level because competing locally is fundamentally different from competing across a region or the entire country.
Businesses can be evaluated at four levels:
Local - Serving a city or surrounding communities.
Regional - Serving multiple cities, counties, or states.
National - Competing across the country.
International - Reaching customers in multiple countries.
Each level presents different opportunities, competitive landscapes, and digital expectations.
Revenue Opportunity
The Market Revenue Calculator provides an estimate of the potential annual revenue available based on the project size, pricing, and monthly project assumptions you enter.
The calculation is intended for planning purposes and illustrates the size of the opportunity rather than predicting future sales. Actual business performance depends on market demand, competition, procurement cycles, pricing strategy, operational capacity, and ongoing investment in marketing and business development.
Market Recommendations
Every business has different strengths and priorities. Some companies need stronger visibility, while others benefit from improving trust, showcasing completed sports facility projects, or expanding into additional markets.
Your recommendations are designed to help identify practical opportunities for strengthening your Digital Entity and improving your ability to compete within the selected market.
Compare Additional Markets
Many synthetic turf businesses serve several different markets, including sports facilities, education, parks and recreation, municipalities, hospitality, commercial landscapes, multifamily communities, retail, and residential projects. However, success in one market does not automatically translate into another.
Evaluating multiple markets helps identify where your business already has a competitive advantage and where additional digital assets may create new opportunities for long-term growth.
More Public Markets
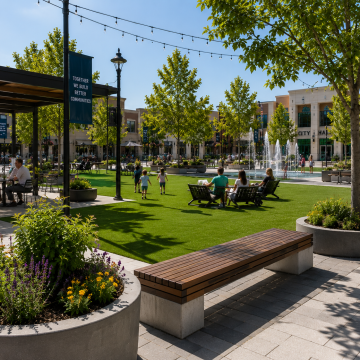
Municipal Market Readiness
Municipal projects include civic plazas, town centers, government facilities, public buildings, and community improvement initiatives where durable, low-maintenance landscapes are required.
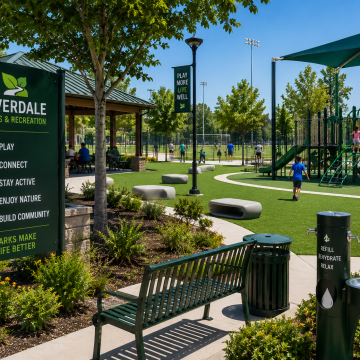
Parks & Recreation Market Readiness
Parks and recreation projects include neighborhood parks, playgrounds, walking trails, sports areas, dog parks, and outdoor community spaces designed for year-round public use.
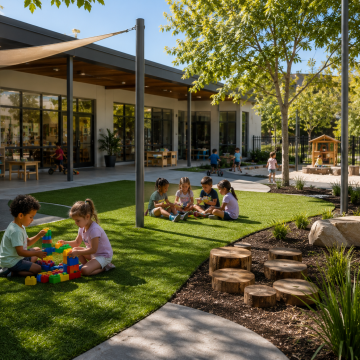
Education Market Readiness
Education projects include childcare centers, K - 12 schools, colleges, universities, and campus outdoor spaces that require safe, attractive, and low-maintenance landscaping.
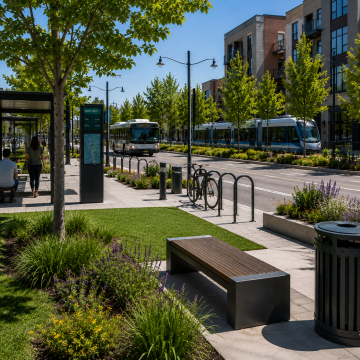
Transportation & Streetscapes Market Readiness
Transportation and streetscape projects include roadway medians, transit facilities, pedestrian corridors, public rights-of-way, and urban beautification initiatives.
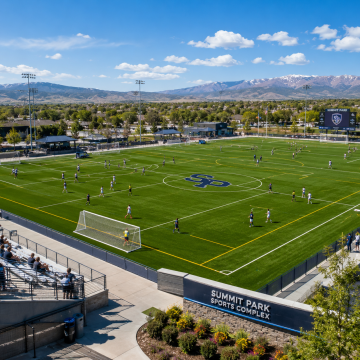
Public Synthetic Turf Market
Evaluate opportunities within education, municipalities, parks and recreation, sports facilities, and transportation projects. Understand how your Digital Entity performs across public-sector markets and identify where additional authority can improve competitiveness.
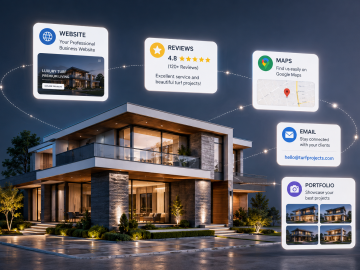
Sports Facilities Market Readiness
Understand how prepared your business is to compete. The Market Readiness evaluation measures your Intent, Presence, and Authority, helping identify strengths, weaknesses, and opportunities across your digital presence.